Your Guide to the TikTok Analytics Dashboard
Master your TikTok Analytics Dashboard. Use key metrics to understand performance, grow your audience, and build a winning content strategy.
Before you dig into what works on TikTok, you need to get the data. That happens in the TikTok analytics dashboard. The key to it is a TikTok Business Account. This is your command center for understanding video performance, follower growth, and your account's health.
How to Access Your TikTok Analytics Dashboard
First, you cannot analyze what you cannot see. Personal accounts on TikTok do not have access to the detailed metrics you need to build a strategy. The first step is making the switch to a Business Account.
This is free and only takes a minute. If you use a personal account, you are flying blind and missing crucial insights.
Switching to a Business Account
Ready to make the change? It is a quick process.
- Go to your TikTok profile and tap the three horizontal lines in the top right.
- Choose "Settings and privacy" from the menu.
- Tap on "Account," then hit "Switch to Business Account."
- TikTok will ask you to pick a category that fits your brand or content. Choose the one that makes the most sense for you.
- Follow the last couple of prompts, and you are all set.
Once you switch, your analytics dashboard is officially available. You need to have at least one public video posted for TikTok to start collecting data. An empty profile means an empty dashboard.
Navigating to Your Analytics
Now that you are set up, finding your data is easy on your phone or a computer.
On the mobile app:
- Go back to your profile and tap the menu icon again.
- This time, select "Business Suite."
- From there, tap "Analytics" to see everything.
On a desktop:
It is easier. Log into TikTok in your web browser, hover your mouse over your profile icon, and click "View Analytics" from the dropdown menu. Both paths lead to the same data. Getting comfortable with these numbers is a universal skill. Understanding different types of creator analytics helps you measure success on any platform you use.
Think of your TikTok analytics dashboard as your mission control. It is where you stop guessing what your audience wants and start making strategic decisions backed by real data.
Understanding the Dashboard Layout
Once you are in, you will see your data organized into four main tabs. Each one gives you a different piece of the puzzle. Getting to know them is key to finding the answers you are looking for.
- Overview: This is your high-level view. It shows you the big picture with metrics like total video views, profile views, and your follower count over the last 7, 28, or 60 days.
- Content: Here you zoom in on individual videos. You will find stats like average watch time, where your views came from, and audience retention graphs.
- Followers: This tab is all about your community. Get a breakdown of your audience demographics, including their gender, top countries and cities, and when they are most active on the app.
- LIVE: If you go live on TikTok, this tab is for you. It tracks key stats from your streams, like total viewers, new followers you gained, and how many diamonds you earned.
This layout is intuitive, letting you move from a broad summary of your account's performance to the details of a single video. It is the foundation for building a content strategy that works.
Diving Into Your Performance: The Overview Tab
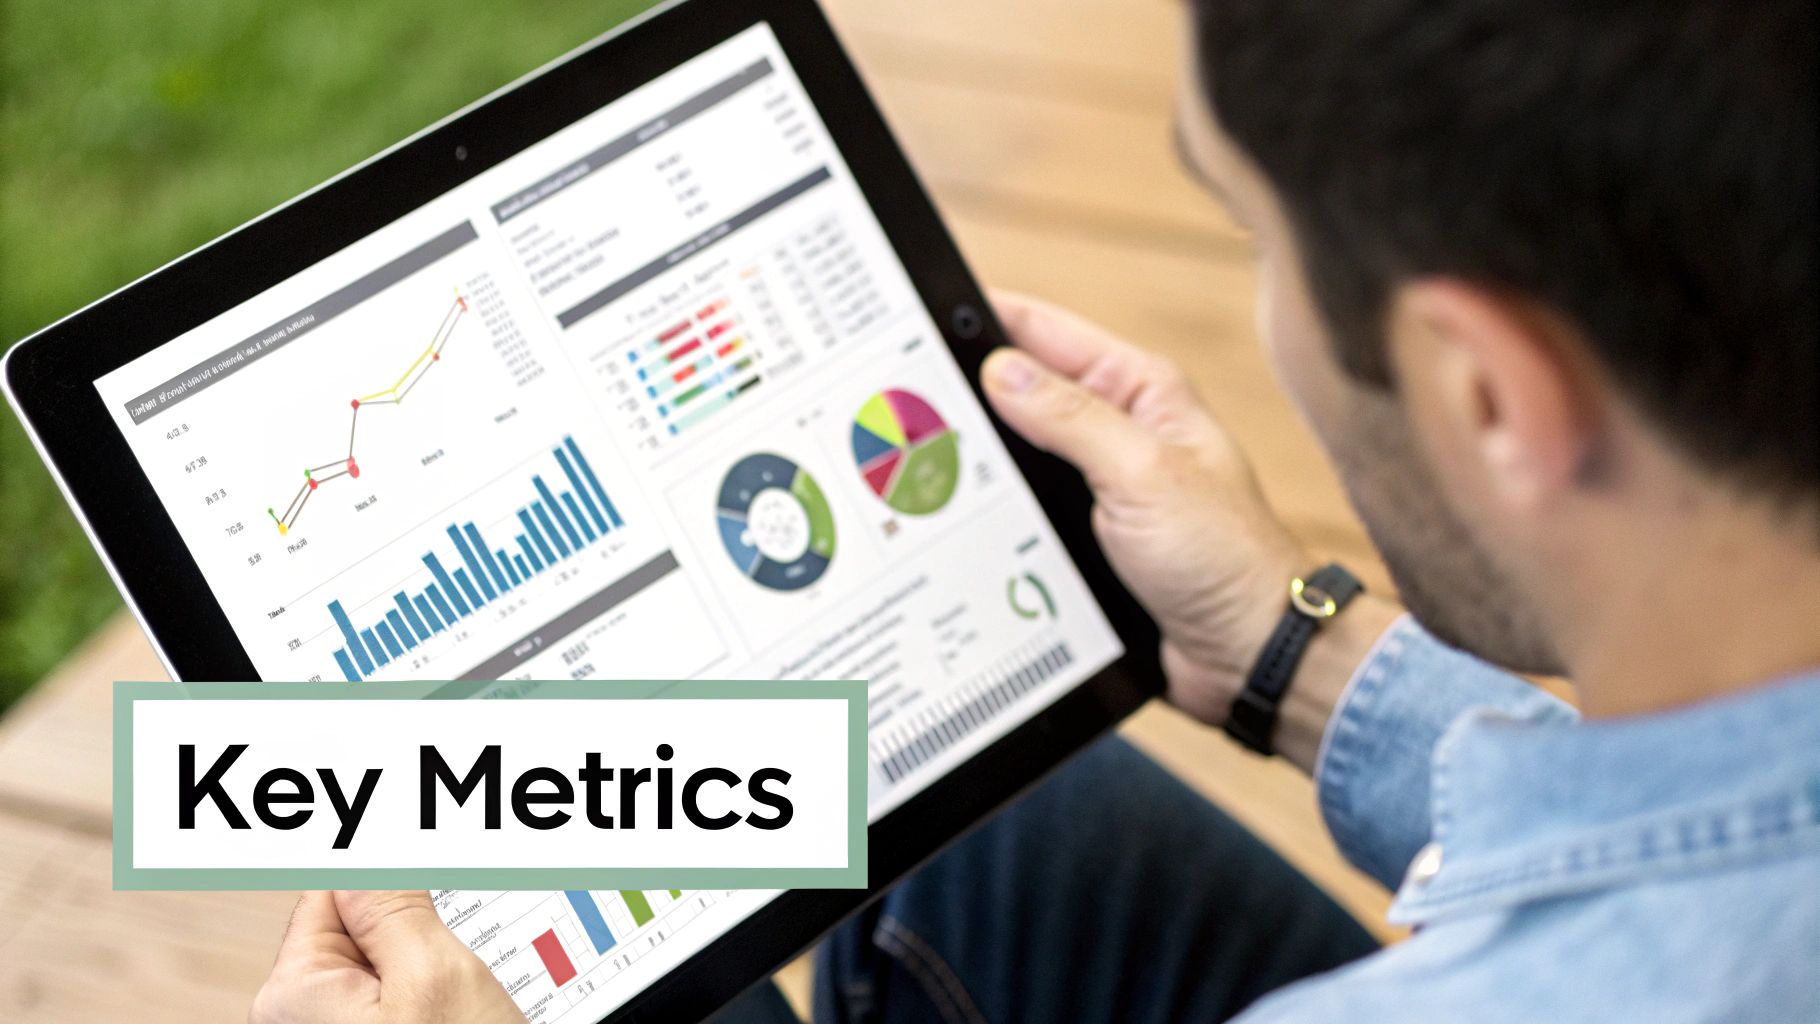
Think of the Overview tab as the command center for your TikTok account. It is where you get a quick, at-a-glance summary of your performance, showing you the most vital stats without getting lost in the details. This is the first stop for a high-level health check on an account's growth and engagement.
The first thing you will notice is the ability to filter your data by different time frames. You can toggle between the last 7, 28, and 60 days. You can also set a custom date range, which is perfect for focusing on specific periods, like the week you launched a new series. This flexibility is key to connecting your actions to results.
This bird's-eye view helps you track your progress over time. You are looking for a steady upward trend across the board. That is the sign your content strategy is working and you are building a connection with a growing audience.
The Core Engagement Metrics
Right away, the Overview tab highlights five core engagement metrics. Each one tells a different part of the story about how people react to your content. Getting comfortable with these numbers is the first step toward making smarter decisions.
- Video Views: The total number of times your videos were watched in the selected timeframe. This is your primary measure of reach.
- Profile Views: This shows how many people were curious enough to click through and visit your profile page. A high number here is a sign your content makes people want to learn more about you.
- Likes: Simple, direct, and a clear signal of audience appreciation. This tells you which videos resonated with viewers.
- Comments: Comments signal a deeper level of engagement. Your content sparked a conversation or a strong emotional reaction.
- Shares: Shares are the ultimate compliment. When someone shares your video, they are personally vouching for it to their friends and followers, which is organic marketing.
Looking at these metrics together gives you the full picture. For instance, a video with tons of views but few likes might have had a great hook, but the rest of the video did not deliver. A video with a high share rate probably delivered value or was relatable.
Watching Your Follower Count Grow
Beyond the immediate video stats, the Overview tab gives you a dedicated graph for your Followers. This visual chart shows your net follower growth over time, making it easy to see how your community expands at a glance.
A steady climb in followers is direct proof your content is reaching new people and convincing them to stick around for more. This is important because your followers are your built-in audience, the people most likely to see and engage with everything you post in the future.
With an estimated 1.59 billion monthly active users on TikTok by early 2025, the potential for growth is enormous. Analyzing your follower trends helps you understand how well you are capturing a piece of that audience. You can dig deeper into TikTok's global user statistics to appreciate how fast the platform is growing.
Your follower count is not a number to brag about. It represents the size of the audience you own on the platform, a community that has explicitly raised their hand to say, "Show me more of your stuff."
This is where the insights come from. By cross-referencing your follower growth with your content performance, you can start answering important questions. Did that one viral video lead to a spike in followers? Did your numbers dip when you took a week off from posting? The Overview tab in your TikTok analytics dashboard gives you the data you need to find those answers and fine-tune your strategy.
Analyzing Video Performance with the Content Tab
If the Overview tab gives you the high-level view of your account, the Content tab is where you get specific. This is where you dig into why some videos take off while others do not. Forget total views for a second. This is about understanding the DNA of your successful content.
Right away, you will see a list of your videos from the last seven days, with the newest ones at the top. The "Trending Videos" section flags the posts that are getting a surge in views, helping you spot your breakout hits in real time.
Decoding Individual Video Metrics
Click on any video in this list, and you will find a lot of data. These are not vanity metrics. They are the breadcrumbs that show you exactly how people behaved from the second your video started playing. Getting a handle on these numbers is non-negotiable if you want to create better content.
To get a feel for a video's performance, let's look at the metrics that tell the most compelling story.
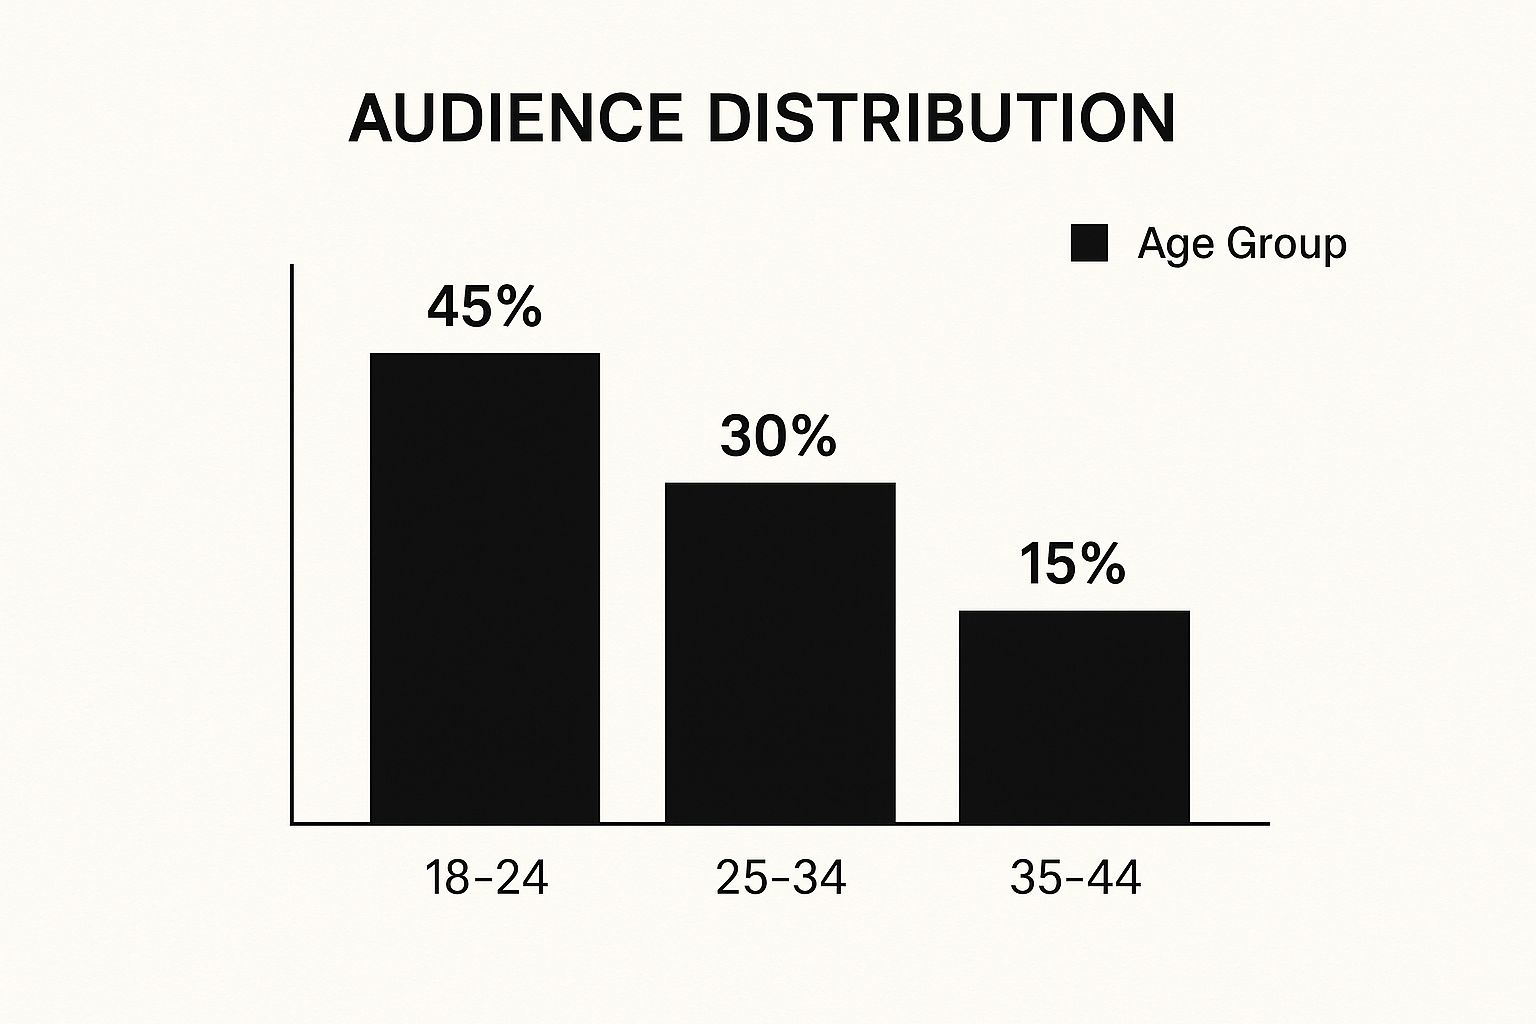
As you can see, the 18-24 age demographic is a huge piece of the puzzle for many creators on the platform. Understanding who is watching is the first step, and understanding how they are watching is the next.
Let's look at the core metrics that reveal viewer engagement and what they mean for your videos.
Key Video Performance Metrics Explained
This table breaks down the most important numbers you will find when you click on an individual video. Think of these as your content's report card.
So, what does this look like in practice? Suppose you posted a 15-second video and its average watch time is 14 seconds. That is a home run. But if you post a 60-second video and the average watch time is only 10 seconds, it tells you something important: your hook was great, but the rest of the video could not hold their attention.
Pinpointing Your Traffic Sources
Okay, so you know how long people are watching, but how did they find your video in the first place? The "Traffic source types" section answers this critical question, breaking down every view by its origin. This data is your roadmap for getting discovered.
Knowing where your views come from helps you fine-tune your strategy to work with the algorithm and appear in user searches.
- For You Page: This is the big one. Views from the FYP mean TikTok's algorithm is serving your video to a wide audience. It is the engine of viral growth.
- Profile: Someone liked what they saw, visited your profile, and decided to watch more. A lot of traffic from here means your overall brand and page are compelling.
- Following: These views are from your loyal fans, your existing followers. This metric is a health check for how well you are engaging your core community.
- Search: This means your video's description, hashtags, or on-screen text matched what someone was actively looking for. It is a key part of any solid content marketing plan.
- Sound: Did you use a trending sound? Views from this source come from people who tapped on the sound from another video and found yours. It shows you are tapping into current trends effectively.
Analyzing traffic sources tells you if your growth is coming from viral reach (For You page) or from targeted searches and community engagement. A healthy account will show a mix of different sources.
By making the Content tab a regular stop, you start to see the patterns. You will learn which formats, topics, and video lengths consistently win. This data-driven approach takes the guesswork out of creation, letting you replicate what works and abandon what does not.
Learning About Your Audience in the Followers Tab

Making content without knowing who you are making it for is like telling a joke in an empty room. To make an impact, you have to know who is on the other side of the screen. The Followers tab in your TikTok analytics is your window into that world, showing you exactly who makes up your community.
This is where we move past video views and likes to focus on the people who hit that "follow" button. Digging into this data helps you stop guessing what your audience wants and start creating content that you know will land. It is how you build a real, engaged community.
Understanding Follower Demographics
Right away, you will see a breakdown of your audience demographics. This is the foundational stuff, the basic info you need to nail down your content's tone, topics, and vibe. The dashboard gives you two key pieces of information here.
First is Gender, showing the percentage split of your followers. This simple insight can help you tweak your messaging and cultural references. For instance, if you have a mostly female audience, you might lean into topics or products that you know resonate more strongly with that group.
Next is Top Countries, which shows you where in the world your followers are tuning in from. This is huge for understanding your global reach. If you see a big chunk of your audience is from a specific country, you could create content that gives them a nod, perhaps referencing a local trend or holiday, to make them feel seen.
TikTok's audience is diverse. The U.S. leads the pack with around 135 million users as of early 2025, but other countries like Indonesia (107.7 million) and Brazil (91.75 million) are right behind. Knowing where your followers fit into this global map helps you make smarter choices. You can get a broader view of these trends from resources like Sprout Social.
Pinpointing Follower Activity
This next part is where the magic happens. The Follower activity chart is arguably the most effective tool in this entire tab. It is your secret weapon for getting more eyes on your videos, showing you the exact hours and days your followers are most active on TikTok.
No more posting and praying. This chart tells you exactly when your audience is scrolling, so you can drop your content at the perfect moment for maximum impact.
The chart itself is straightforward, showing clear spikes in activity that pinpoint the best times to post for that initial burst of engagement.
Using the Follower Activity chart is one of the easiest and most effective things you can do to improve your reach. When you post during these peak hours, your video gets a head start, signaling to the algorithm that people are interested and it should be pushed out to a wider audience.
So, how do you put this into practice? It is simple.
- Spot Your Peak Days: Look for the days with the tallest bars on the graph. That is when most of your community is online.
- Find Your Peak Hours: On those key days, zoom in on the specific hours when activity surges. For many, it is the evening, but your audience could be different.
- Schedule Your Posts: Aim to publish your best content about an hour before that peak time hits. This gives the algorithm a little time to index your video so it is ready to go when your audience logs on.
By consistently using the insights from the Followers tab, you shift your content strategy from shouting into the void to having a real conversation. You learn who your audience is, where they live, and when they are ready to listen. This is how you build a loyal following that does not watch, but connects with what you create.
Evaluating Your TikTok LIVE Performance
Going live on TikTok is a different experience. It is your chance to connect with your audience in real-time, with no scripts and no edits, just you and your community. But how do you know if your LIVE sessions are hitting the mark? The LIVE tab in your analytics provides that information.
https://www.youtube.com/embed/UxyxyWPZBkk
Think of this section as your command center for all things LIVE. It pulls together all the important data from your broadcasts over the last 7 or 28 days. By digging into these numbers, you can start to see what makes your audience tick, what topics get them excited, and what formats keep them on the screen.
Core Metrics for Your LIVE Streams
When you first open the LIVE tab, you will see a quick snapshot of your performance. Each number tells a piece of the story about how people are interacting with your streams. Getting a handle on these is the first step to building a smarter LIVE strategy.
Here are the key metrics you will see right away:
- Total Views: This is the grand total of people who dropped into your LIVE stream at any point. It is a great measure of your overall reach.
- Total Time: This one is simple. It is the combined time you spent broadcasting during the date range you have selected. It helps you track your consistency.
- New Followers: This counts how many people hit that follow button while you were live. This is an indicator that your content was compelling enough to turn a casual viewer into a new follower on the spot.
These metrics give you a great high-level overview. If you see a big spike in new followers from a particular stream, you know you have found a topic or format that is a driver for your account's growth.
Deeper Insights into Viewer Engagement
The basics are great, but the real magic happens when you go a level deeper. The LIVE tab gives you more detailed stats that reveal how your audience behaved during your broadcast. This is where you find out who is loyal, who is engaged, and who is willing to show their support.
Your LIVE analytics show more than who watched. They reveal who stayed, who engaged, and who showed their support. This information is critical for creating streams that your community will return for.
Let's unpack the metrics that give you this richer understanding.
Unique Viewers
This number tells you how many individual people watched your LIVE, counting each person only once, even if they popped in and out multiple times.
So, if your Total Views are 5,000 but your Unique Viewers are 3,500, it is a good sign. It means a lot of people were coming back for more or stuck around for a long time. This metric gives you a more accurate picture of your actual audience size for a broadcast.
Diamonds Earned
During a LIVE, viewers can send you virtual gifts, which you collect as Diamonds. This metric tracks the total number of Diamonds you have received.
Since these gifts are bought with real money, Diamonds are a direct reflection of how much your audience values what you are doing. It is a signal of appreciation and a clear sign that your content is something people are willing to support financially. Pay close attention to which streams earn the most Diamonds. They are pointing you directly to your most valuable content.
Applying Analytics to Your Content Strategy
Data is just noise until you use it to make decisions. This is the moment you turn those graphs and numbers from your TikTok analytics into a concrete game plan for making better, smarter content. It is all about translating metrics into actions to build a strategy that works.
The process kicks off when you pinpoint your best-performing videos. Go into your Content tab and look for the posts with great average watch times, high completion rates, and a ton of shares. These are not lucky hits. They are your personal blueprint for what resonates with your audience and the TikTok algorithm.
Replicate Your Success
Once you have identified your winning videos, it is time to be a detective and figure out why they worked so well. The goal is not to make an exact copy, but to understand the core elements that made them successful so you can build on that foundation.
Ask yourself these questions about your top videos:
- The Hook: What happened in the first three seconds? Was it a bold claim, a rapid visual cut, or an intriguing question that stopped the scroll?
- The Format: Was it a quick tutorial, a relatable comedy sketch, a behind-the-scenes glimpse, or a trending listicle? The format is the vehicle for your message.
- The Sound: Did a trending audio clip do the heavy lifting, or was it your own original sound? Your analytics will show how many views originated from that sound's page, confirming its pull.
Suppose a 15-second tutorial using a popular sound and punchy text overlays blew up. Your next move is clear: create another tutorial using that same fast-paced structure. Pick a different but related topic and see if lightning strikes twice. This way, you are building on what is already proven to work instead of throwing content at the wall and hoping it sticks.
Test and Refine Your Approach
Your analytics are just as good at showing you where there is room to grow. The average watch time metric, for instance, is your best friend for figuring out the perfect video length. If you notice viewers consistently leaving your 60-second videos around the 20-second mark, that is a sign to start making shorter, more impactful content.
Think of your average watch time as direct feedback from your audience. A steep drop-off is not a failure. It is a clear signal telling you exactly where your content needs to be tighter and more engaging.
This same idea applies to your posting schedule. The Follower activity chart gives you your audience’s peak hours. Start posting about an hour before those peak times to give your videos the best shot at gaining early traction.
You can also experiment by teaming up with other creators to tap into fresh audiences. Finding the right collaborators through an experienced influencer marketing agency can be a fantastic way to get your content in front of a whole new community of engaged followers.
Using analytics is a continuous loop of action, review, and refinement. Use your smash hits as a template. Let your watch time guide your pacing and length. Use your follower data to build a posting schedule that gets you seen. This systematic approach transforms your TikTok analytics from a simple report card into an active, indispensable part of your content creation machine.
Got Questions? We've Got Answers.
Jumping into TikTok analytics can bring up a few common questions. Let's clear up some of the most frequent ones so you can feel confident in the numbers you are seeing.
How Often Does TikTok Analytics Update?
It is tempting to refresh the page every five minutes, but TikTok’s analytics are not live. Most of your metrics update once a day.
Think of it as getting a daily performance report. For a new video, you will want to give it about 24 hours before you dive into the initial stats. This patience allows TikTok to process everything accurately.
Why Are Analytics Missing for Some of My Videos?
Posted a video and see nothing but zeros in the data? Do not panic. It can take up to 48 hours for analytics to populate for a brand-new post, especially during high-traffic times on the app.
If two days go by and you still see nothing, double-check that your profile is set up as a Business Account. Analytics only start tracking from the moment you flip that switch. Any videos you posted before converting will not have any data logged.
Your dashboard only starts tracking performance from the moment you activate a Business Account. Think of it as the official start line for your data collection journey on the platform.
Do I Need a Certain Number of Followers to See My Analytics?
Good news: you can access the Overview, Content, and LIVE tabs from day one, even with zero followers.
The Followers tab is a bit different. To get those demographic details, like your audience's gender, location, and most active hours, you will need to hit 100 followers. Once you cross that milestone, that tab will light up with all the information you need to get to know your audience better.
At Adworkly, we turn these analytics into actionable growth strategies. See how our expertise can translate your data into measurable results. Learn more at adworkly.co.